A microbit Rain Gauge
Introduction
This project shows how you can build a Rain Gauge.
Traditional rain gauges use a tube, like the one below. Someone has to go outside to the tube each day and measure the depth of water collected since the previous day.

We would like to record any rain automatically, so we need to find a different method of measuring depth.
One method is to measure the resistance of the water in the tube. Resistance is a measure of how much electric current can flow in something when we apply a voltage (from a battery, for example).
Measuring the resistance
Water, if it is not perfectly pure, conducts electricity. Rainwater has a quite well-known resistance. So the idea is to put two wires in the water and measure the current flow through the water between the wires. This article explains a bit more.

To get good accuracy we need to make the area of the wires as big as possible; I am using some aluminium plates. Our gauge will look a bit like this:
Construction
The plates are each about 50 mm by 100 mm (I cut a 100 x 100 mm plate into two). They are separated by about 20 mm. I found that if I had them very close then the results were rather erratic. The separation is done using some nylon screws and nuts (make sure you use an insulating material for the screws).
Here is a photo of me measuring the resistance of some rain water. Note - it’s a good idea to use a tube with straight sides. I bought a measuring cylinder on eBay.

You can test with tap water, but it has a much lower resistance than rainwater.
To measure the resistance of the rain gauge with a microbit, we can use its built-in Analog-to-Digital converter (ADC). We connect the 3.3 V power to a resistor in series with the rain gauge, and measure the voltage across it. I am using the microbit’s P0 pin to make the measurement, but you can use another pin - especially if you also want to connect a temperature/humidity sensor, to build a more complex weather station.
The power to the resistors is switched off when we are not reading, using pin P1. This saves battery power and also reduces an unwanted side-effect: if the water is a bit acidic, which tap water can be, then the flow of electricity can cause something called electrolysis. Over a few hours that can lead to some of the metal being removed from one of the plates! So the idea is to let the electric current flow for a short time - maybe 20 seconds or so. I found I needed a longer time, about 50 seconds, to make sure the readings settled down to a more-or-less steady value.
 |
| Schematic |
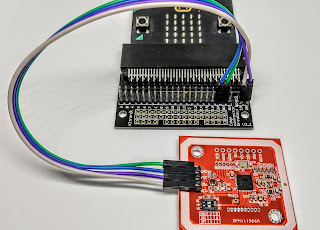
I wired up the rain gauge to the microbit (using the microbit’s expansion connector and a 5601B breakout board) and a resistor. You can use a value of around 10 kohms - its value isn’t critical because you will now calibrate the rain gauge depth. The value does need to be high enough to get a big change in the voltage as the water fills up. Try some different values.
 |
| Wiring diagram |
And this is a photo of the wiring:

Calibration
We can now fill the rain gauge with varying depths of water and measure the ADC output.
I ran this code on the microbit:

The code reads the voltage on Pin 0 of the microbit and saves it as a variable named P0voltage. Then the microbit displays P0voltage while I am pressing button A. A reading of 1023 is equivalent to 3.3 Volts, and a reading of 0 is equivalent to 0 Volts.
Then I filled the cylinder with water to a depth of 10, 20 mm and so on up to 70mm and recorded the readings of P0voltage in a spreadsheet:
 |
| Recorded measurements |
Then I filled the cylinder with water to a depth of 10, 20 mm and so on up to 70mm and recorded the readings of P0voltage in a spreadsheet:
A spreadsheet is quite handy because you can draw a chart (or graph) to see how the readings (the blue curve below) change with water depth:
 |
| Spreadsheet chart |
To do this we can ask the chart to draw a linear trend line and show us the equation. In Google sheets it looks like the red line above. There are more accurate trend lines you can use, such as a polynomial.
So, when we get a P0voltage reading we can find the water depth from this equation:
Water depth = (735 - P0voltage)/5.1
We are going to get an error of about 5 mm, which isn’t too bad!
Final code
Now we can write code to read the rain gauge every hour, and send it over our USB link to a computer. On that computer, we can record the readings.
This is my code, using two blocks. The on start block sets up some variables, then shows the “tick” icon - this prompts you to press button A to start the measurements.

The other block, on button A pressed, takes the measurement every hour and sends the result to the computer via USB. It shows a smiley face icon when it is reading, and a sleep icon for the rest of the time.

Results
To view and record the results I used MakeCode’s data logger - click Show console device under the microbit picture. See this article for further information.When you save the data to a file it also saves relative time, in seconds. By that, I mean the time from when you started. So you will need to note the start date and time.

Here are some example results.
 |
| Raw data from the CSV file (spreadsheet view) |
Next, I have put the date and time in a new column, based on the relative time in column A. I have added some column headings too.
 |
| Date and time added |
Finally, I have added column D which has the water depth. This has been calculated using the formula from our calibration.
 |
| Calculated water depth added in column D |
Further steps
When you put the rain gauge outside you should place it in a container so that it isn’t affected by wind. Note that the water in it will evaporate in hot weather. Also it should be emptied before it gets too full. You could write some code to warn you when the water reaches a particular level!
You can use the spreadsheet to calculate the rainfall for each day, and perhaps the amount of rainfall per hour.


Comments
Post a Comment