Microbit weather station
Microbit V1 weather station
Update: Feb 2021: I've published the microbit V2 version using Bluetooth (BLE)
Update 7th Jan 2021: I've found an error in my DS3231 extension, so now it is feasible to use the microbit's Bluetooth (BLE) - which means the second microbit won't be necessary. And I fixed my Google Apps Script code for the chart!
This project lets you make regular hourly readings of weather measurements, store them, and upload them to a phone or computer. The date and time of each reading are also recorded. You can use the readings to plot a chart, for example, to show how the weather changed over time. Here's a set of readings over 24 hours:

These are the measurements I am using for this project:
- Barometric air pressure
- Temperature
- Humidity
You can add more "instruments" - for example, I plan to add a home-made rain gauge, as described in this blog.
The weather station can be self-contained, powered from a couple of batteries perhaps. You can use a number of different methods to upload the readings, including USB or the microbit's own radio. I found that the V1 microbit can't handle Bluetooth because there isn't enough memory once the 3 extensions (needed for the measurements) are loaded. I will be testing a V2 microbit soon to see if the extra memory allows it to work with Bluetooth.
For this project, I have used the microbit's USB built-in proprietary radio, which has much less memory overhead than Bluetooth. To be able to upload the measurements to a phone or computer we need another microbit to receive the radio messages and relay them to the device via USB, for example. The drawing below shows the idea.
| Uploading readings via microbit radio |
I am uploading my readings to an Android phone, using the Serial USB Terminal app on the phone. Here's a screenshot of some readings:
 |
| Readings on an Android phone |
The app also allows you to save the readings to a file, so that you can process them - to create a chart for example.
I have found that I can store more than 200 readings on the weather station microbit before it runs out of memory (the display will show "021" when that happens, and the program will reset). So that is many days worth of readings before you need to upload them and reset the storage. But you would probably want to upload them more frequently.
The measurements use a number of small boards which are connected to the microbit:
- A DS3231 Real Time Clock board keeps track of the date and time (including a battery backup). It also has an alarm function which tells the microbit when to upload its readings.
- A BMP280 board measures air pressure.
- A DHT11 board measures temperature and humidity - I have the DHT11 outdoors, connected to the microbit over a long cable.
The first two boards are connected to the microbit using its I2C bus, which has separate data and clock signals on the (fixed) SDA and SCL pins. The DHT11 uses a proprietary single wire interface, and we can choose which microbit input/output pin to use.
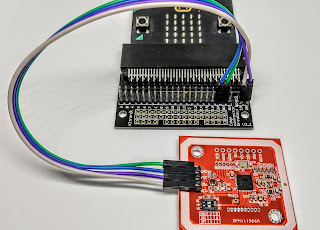
Assembling the boards
I've connected the boards to the microbit using a Kitronik CREATE Proto board. The assembly looks like this:
 |
| Front view |
 |
| Rear view |

and the wiring on the other side of the proto board:
 |
| Wiring |
Schematic

Coding the microbit
I decided to control the weather station using the microbit's buttons. As there are only 3 simple ways of using these (pressing button A, button B, or both A and B together), I used them as follows:
- A: upload stored measurements
- B: delete stored measurements and restart.
- A+B: set the time on the RTC
My code is separated into functions - this makes it easier to debug if things go wrong, and it's also easier to describe each block.
The code uses several extensions; these can be loaded into the MakeCode editor via the Advanced > Extensions > Search menus and choosing these:
 |
| Barometric air pressure |


Code for the weather station microbit
This code is available on github.
The on start block creates 3 empty arrays which we use to store the readings. It also sets up:
- the radio group - make sure it's the same group as the receiver microbit!
- a limit, readingsMax, for the number of readings
- the DS3231 clock to generate an alarm every hour, on the hour
and finally, it sends 3 radio messages to the receiver microbit. This allows you to check that everything is working when you first switch on.
 |
| on start block |
The forever block polls the P0 pin - which is set to 0 when the alarm is triggered - every 10 seconds. When P0 is at 0 the code gets a reading from each instrument and stores it in the appropriate Readings array. The reading is a text string and each measurement is separated from the following one by a comma.
This is a common format called comma-separated variables, or CSV for short. It's easy to import CSV files into a spreadsheet.
The code also briefly displays the number of readings in the arrays on the microbit's screen. That's useful for making sure that the code is running as expected!
 |
| forever block |
The functions which are used when we build the Readings arrays are described next, starting with the dateTimeString function. This uses the DS3231 extension to read the date and time components. To improve the format of the readings we insert a 0' in the text version of a number less than 10, using another function, leadingZero.
 |
| dateTimeString function |
 |
| leadingZero function |
 |
| airPressure function |
The temperature function uses the DHT11_DHT22 extension to read the temperature and humidity. There is a slight complication in the code - because the DHT11 may be connected by long wires to your microbit. I found that the wires could become disconnected, so it's worth checking that the reading is valid before recording it. This is done with an if block.
 |
| temperature function |
Finally we have code blocks to send the array of readings to the radio (when button A is pressed), empty the array (on button B), and set the RTC's date and time (buttons A and B together).
The button A code, together with the radio receiver microbit's code, uses a handshake. It works like this:
- When the weather station microbit needs to send a message to the radio receiver microbit, it waits until the variable ack is 0.
- When the radio receiver microbit has received the message and it has processed the message, it sends a radio message, containing the text "ACK" back to the weather station microbit
- Another code block (on radio received) detects this message and sets ack to 1
The button A code also inserts the * character before the dateTime reading string; this allows us to identify it in the receiver microbit.
 |
| Button A code |
 |
| On radio received code |
 |
| Button B code |
Note that before you set the time on the RTC you will need to adjust the code values in the block and download the updated code to your microbit!
 |
| Button A+B code |
Code for the radio receiver microbit
This code is available on github.
This microbit simply waits for radio messages from the weather station microbit. When a message arrives we look at the first character of the message, and if that is a * then we know it is the dateTime message. We can then assemble it and the following 2 messages and send them as one reading to the USB.
After that we send a radio message "ACK" to the weather station microbit.
 |
| Radio receiver code |
Powering the weather station
I found that, if I powered the microbit from a USB lead plugged into a computer, then I had the occasional reset. I'm not sure why, so I used a USB charger instead and this now seems much more reliable.
Drawing a chart
Combining the three readings onto one chart isn't straightforward. I used a Google Sheets script to automate the process. Here is my code:
function onOpen() {
//This uses the EmbeddedChart Class!
var sheet = SpreadsheetApp.getActiveSheet();
var range = sheet.getRange("A1:D25");
var chartBuilder = sheet.newChart();
var headerRow = sheet.getRange(1,1,1,4).getValues()
chartBuilder.addRange(range)
.setChartType(Charts.ChartType.LINE)
.setPosition(5, 6, 0, 0)
.setOption('title', 'Readings')
.setOption('legend', {position: 'top'})
.setOption('series', {
0: {targetAxisIndex: 0,labelInLegend:headerRow[0][1]},
1: {targetAxisIndex: 1, labelInLegend:headerRow[0][2]},
2: {targetAxisIndex: 1, labelInLegend:headerRow[0][3]}
})
.setOption('vAxes', {
0: {title: 'Pressure', viewWindow: {min: 950, max: 1050}},
1: {title: 'Temperature & Humidity', viewWindow: {min: -20, max: 40}}
})
;
sheet.insertChart(chartBuilder.build());
}
Going further
Here are some ideas on extending the basic design above.
- Use BLE (Bluetooth Low Energy) to upload the readings directly to a phone or computer. As mentioned, the V1 microbit hasn't got enough memory to use BLE with the code extensions needed for this project, but the V2 may work.
- You can control the weather station from a phone or computer, instead of the microbit' buttons, by sending commands to the microbit via USB or BLE. See this Watkiss blog article.


Comments
Post a Comment