Microbit radio weather station
I've built a couple of microbit weather stations in the past; the last one used Bluetooth to upload readings to a laptop for further processing. This one is aimed at younger students and uses the microbit's built in radio, which is a bit easier to code.
But - this particular one disconnects its output for a short time every 5 seconds - so that it can sense when it's finished charging the phone battery. In order to provide a continuous current to the microbit, and therefore stop it resetting, we need to have a charge reservoir. This can be done by connecting a large capacitor via a diode.
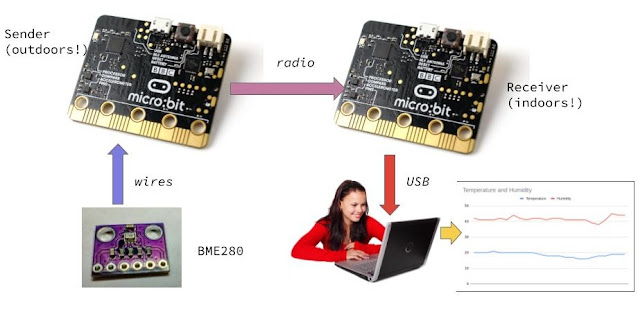
The sender microbit records weather readings every hour or so (your choice). To upload the readings, to make a daily chart or graph perhaps, we use a second receiver microbit to fetch the readings. They can then be sent via USB, or some other means, to a laptop or phone. So the sender can be untouched and in a fairly inaccessible place (depending on the radio range, of course).

Powering the sender
I didn't want to use non-rechargeable cells, so I tried a power bank. This is a high-capacity rechargeable battery which is normally used to supply energy to a phone. It has some clever circuitry which, among other things, disconnects the battery from its load when the load current has dropped.
 |
| Power bank |
 |
| 5V supply circuit diagram |
Unfortunately I found that while some samples worked well, others did not and would not power up the microbit properly. So I have resorted to alkaline AA cells for now - and hopefully I can get a more eco-friendly solution with a solar panel plus battery supply.
The sender
The sender microbit has two small boards attached, connected with an I2C bus. These are:
- a DS3231 Real Time Clock (RTC) board for logging the time and date
- a BME280 sensor board
These are available from a number of sources - typically eBay. When I built this in early 2022 there was a shortage of genuine BME280 sensors, and what you get is more like a BMP280 which doesn't measure humidity. You end up with just Pressure and Temperature, but I have tested with my one genuine BME280!
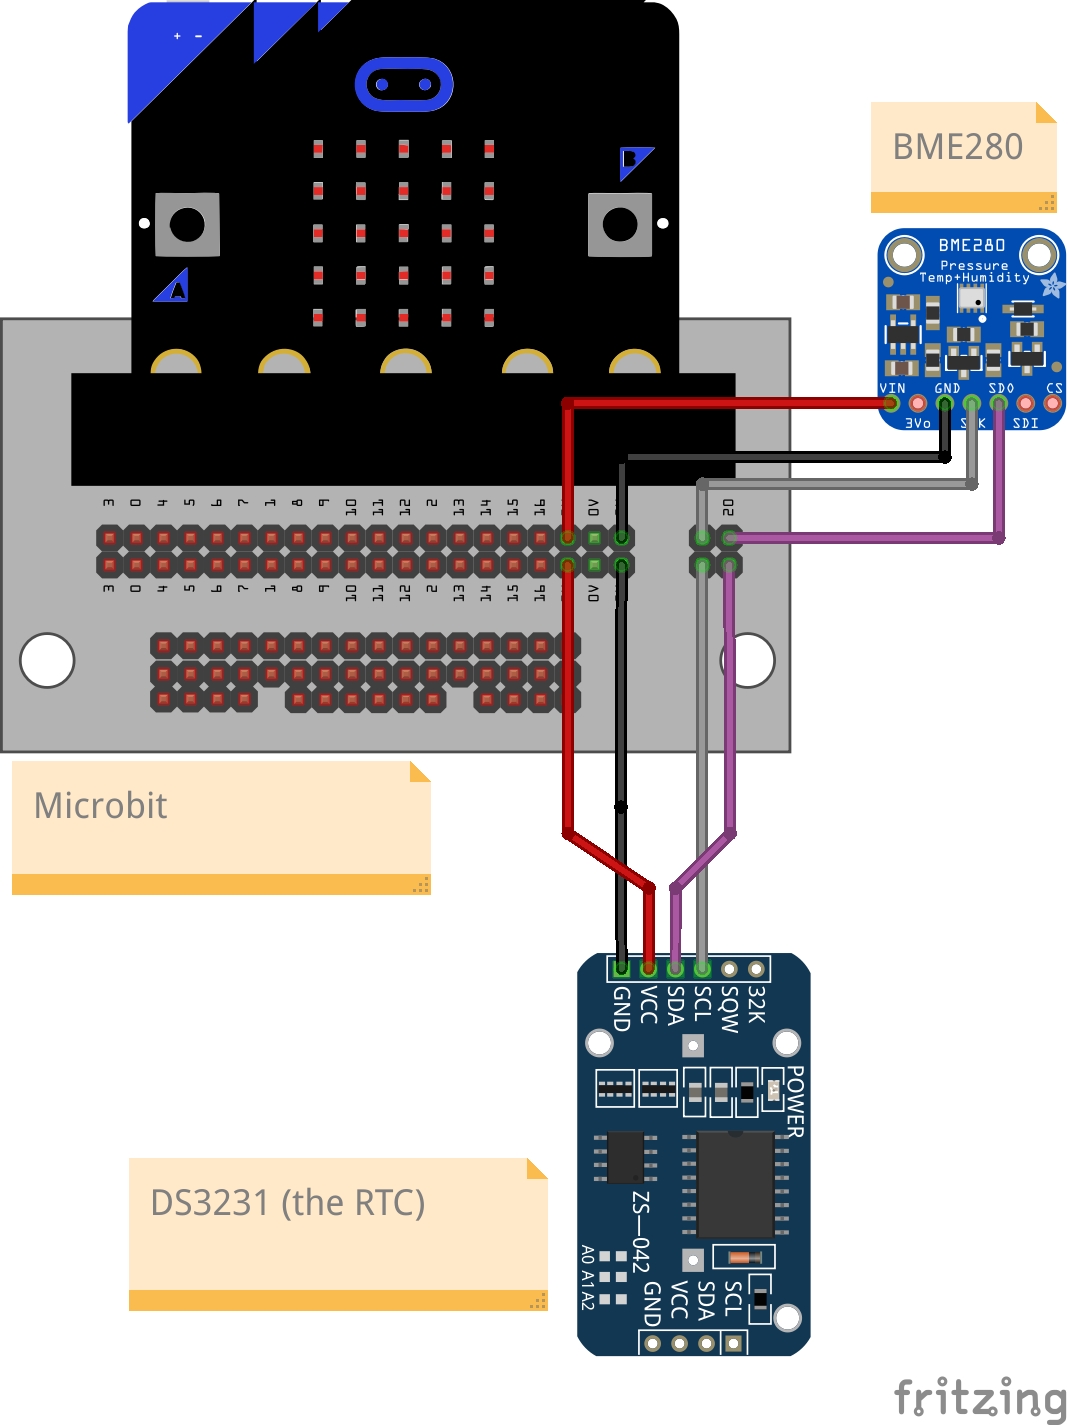 |
| I2C connections |
Hardware
The RTC has a small backup cell which maintains the time if the mictobit power fails - very useful when you are developing a project!
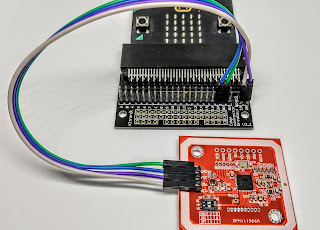
I assembled the boards on a piece of hardboard, using Velcro (very flexible when you change things around!)
 |
| Assembly |
Code/software
The code consists of functions or blocks to:
- get date and time readings from the RTC (stored as text strings)
- get weather readings from the BME280 (stored as a text string of numbers separated by commas)
- perform test functions when the A and B buttons are pressed
- when a radio message is received, send all stored readings back to the receiver microbit, using radio messaging
The A and B buttons are used as follows:
- A: display on the microbit screen the latest recorded date, time, and weather readings
- B: make a weather reading now and display the 3 PTH (Pressure, Temperature, Humidity) values
- A+B together: delete all stored readings
The date/time readings (for example 30/3/2022 8:0) can be up to 16 characters long, and the weather readings (for example 995,19,41) can be up to 10 characters. The microbit's radio can handle messages up to 19 characters, so we have to send the readings separately like this:
 |
| Readings |
The receiver takes care of joining the two messages together so that we can easily import the data into a spreadsheet.
The code includes the ability to set the RTC's time and date when a terminal is connected:
- set time: sthhmm where hhmm is 4 digits representing hours (24 hour mode) and minutes
- set date: sdddmmyyyy where ddmmyyyy is 8 digits representing date, month and year
The microbit code is on Github.
The receiver
This is much simpler - just a microbit with a USB cable to provide power and send data to the connected device. You can use a laptop or phone with a terminal application (e.g. Serial USB Terminal on Android).
Here are some typical readings seen on a web-based terminal:
We can save the readings as a csv (comma-separated variable) file; this can be imported into a spreadsheet such as Google sheets and a graph (chart) generated:
 |
| Results |
 |
| 24 hour graph of Pressure and Temperature |


Comments
Post a Comment